3. The ni.model.pointprocess Module
- class ni.model.pointprocess.PointProcess(dimensionality)[source]
A Point Process container.
Usually generated by loading from a file or via ni.model.pointprocess.createPoisson()
- ni.model.pointprocess.createPoisson(p, l)[source]
This generates a spike sequence of length l according to either a fixed firing rate p, or a repeated sequence of firing rates if type(p) == np.ndarray.
It creates a ni.model.pointprocess.PointProcess
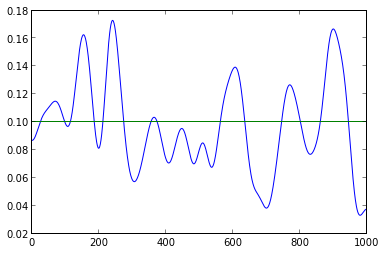
Example 1:
p1 = ni.model.pointprocess.createPoisson(0.1,1000)
p1.plotGaussed(20)
plot(p1.frate)
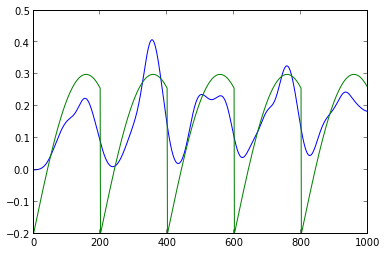
p2 = ni.model.pointprocess.createPoisson(sin(numpy.array(range(0,200))*0.01)*0.5- 0.2,1000)
p2.plot()
p2.plotGaussed(10)
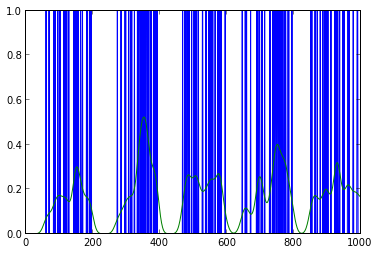
p2.plotGaussed(20)
plot(p2.frate)
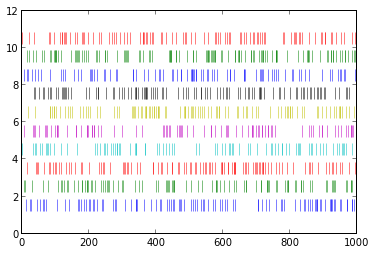
Example with multiple channels:
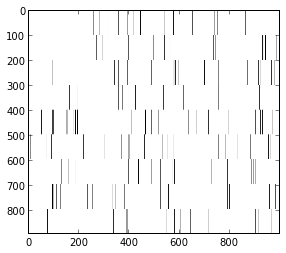
frate = (numpy.array(range(0,200))*0.001)*0.2+0.01
channels = 9

dists = [ni.model.pointprocess.createPoisson(frate,1000) for i in range(0,channels)]
#for i in range(0,9): dists[i].plotGaussed(10)
import itertools
spks = np.array([dists[i].getCounts() for i in range(0,channels) for j in range(0,99) ])
imshow(-1*spks)
set_cmap('gray')
Will generate:
(A plot of spikes)
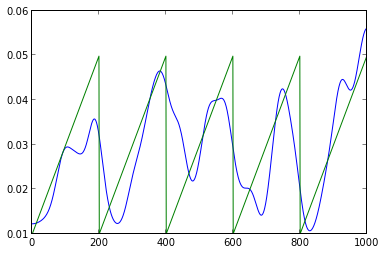
ni.model.pointprocess.plotGaussed(np.array([dists[i].getCounts() for i in range(0,channels)]).mean(axis=0),20)
plot(dists[0].frate)
- ni.model.pointprocess.getBinary(spikes, min_length=1)[source]
Gives back a binary array from an array of spike times. The maximum for each bin is 1.
- ni.model.pointprocess.getCounts(spikes)[source]
Gives back an array of spike counts from an array of spike times. If the output is suppsed to be a Binomial, use getBinary instead.
- ni.model.pointprocess.plotGaussed(data, width)[source]
p2 = ni.model.pointprocess.createPoisson(sin(numpy.array(range(0,200))*0.01)*0.5- 0.2,1000)
p2.plot()
p2.plotGaussed(10)